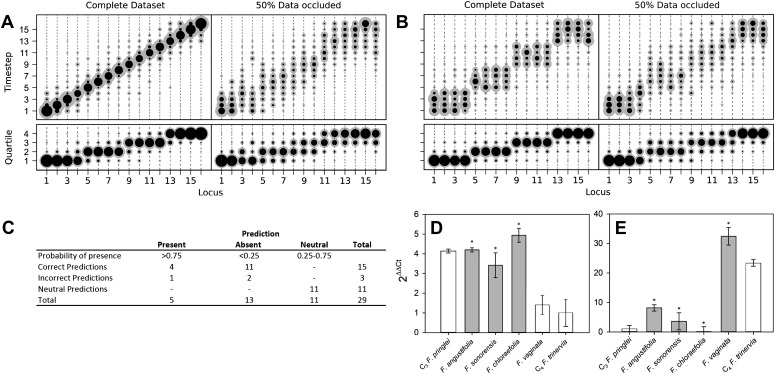
Figure 2. Verifying a novel Bayesian approach for predicting evolutionary trajectories.
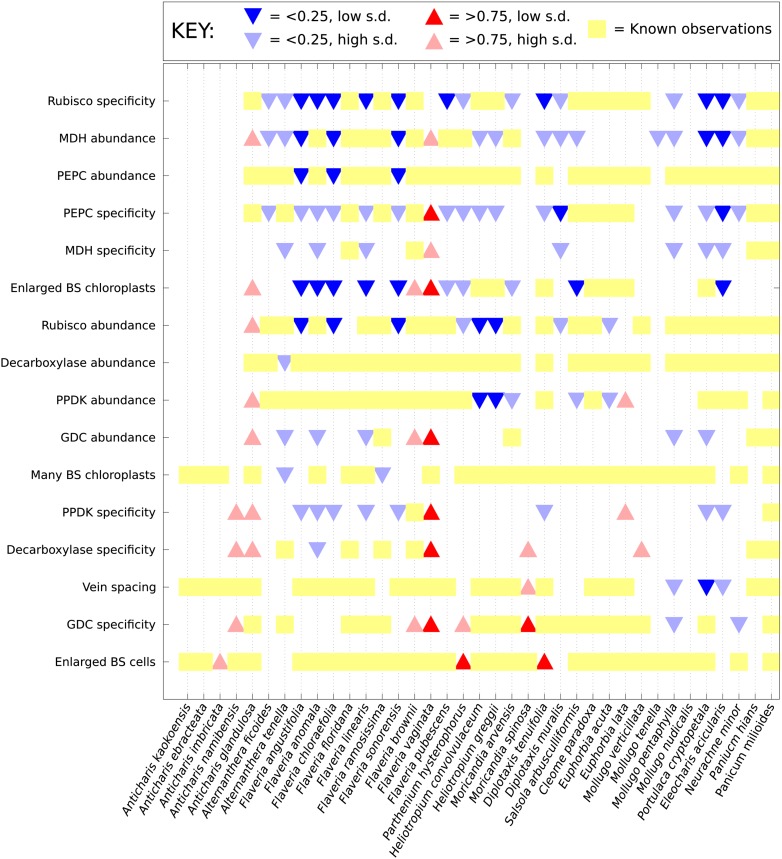
(A and B) Datasets were obtained from an artificially constructed diagonal dynamic matrix (A), and a diagonal matrix with linked timing of locus acquisitions (B). The single, diagonal evolutionary trajectory was clearly replicated in both examples, over a time-scale of 16 individual steps, or four coarse-grained quartiles. We subjected these artificial datasets to our inferential machinery with fully characterised artificial species, and with 50% of data occluded in order to replicate the proportion of missing data from our C3–C4 dataset. (C) When applied to our meta-analysis of C3–C4 data, predictions were generated for every trait missing from the biological dataset. We tested this predictive machinery by generating 29 artificial datasets, each missing one data point, and comparing the presence/absence of the trait as predicted by our approach with the experimental data from the original study. (D and E) Quantitative real-time PCR (qPCR) was used to verify the predicted phenotypes of four C3–C4 species. The abundance RbcS (D) and MDH (E) transcripts were determined from six Flaveria species. White bars represent phenotypes already determined by other studies, grey bars those that were predicted by the model and asterisks denote intermediate species phenotypes correctly predicted by our approach (Error bars indicate SEM, N = 3).


