. 2013 Sep 28;2:e00961. doi: 10.7554/eLife.00961

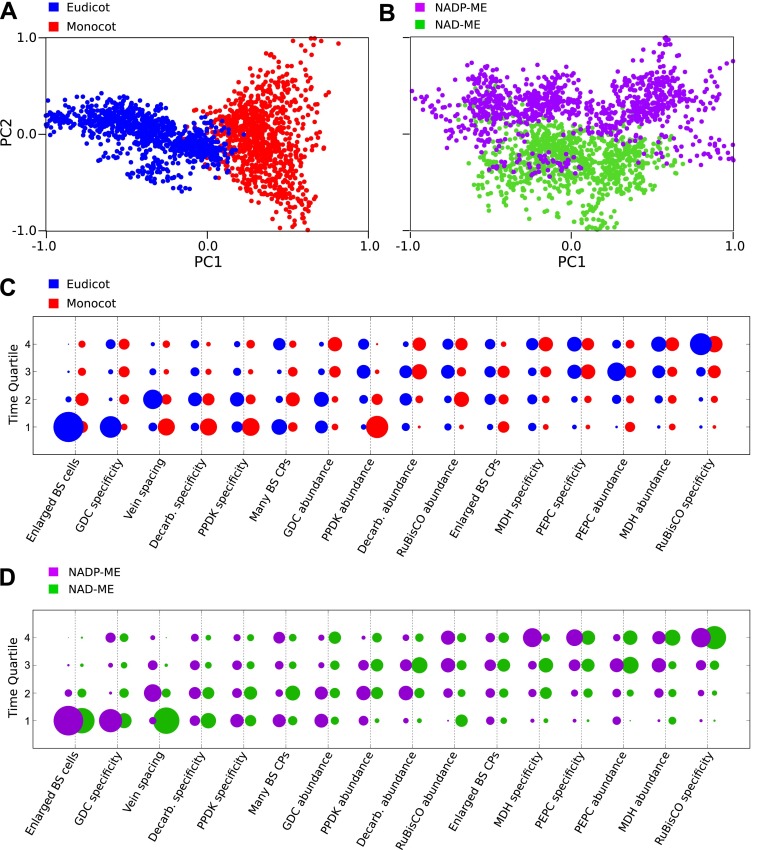
Figure 4. Differences in the evolutionary events generating different C4 sub-types and distantly related taxa.

Principal component analysis (PCA) on the entire landscape of transition probabilities using only monocot and eudicot data (A) and data from NADP-ME and NAD-ME sub-type lineages (B) shows broad differences between the evolutionary pathways generating C4 in each taxon. Monocots and eudicots differ in the predicted timing of events generating C4 anatomy and biochemistry (C), whereas NADP-ME and NAD-ME lineages differ primarily in the evolution of decreased vein spacing and greater numbers of chloroplasts in BS cells (D).

DOI: http://dx.doi.org/10.7554/eLife.00961.016

Figure 4.

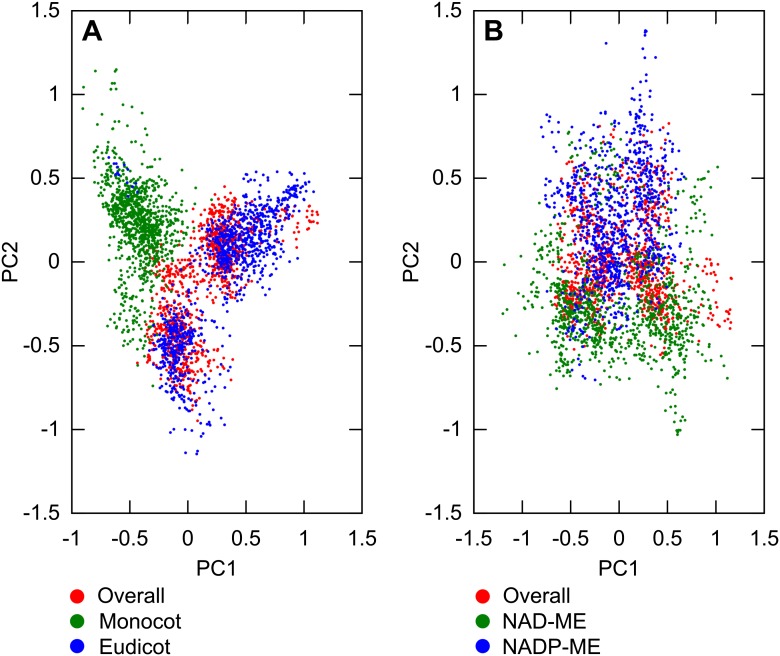
Figure 4—figure supplement 1. Variation between lineages compared to variance of overall dataset.

Figure 4—figure supplement 1.

PCA was performed on sampled transition networks from the sets compatible with the overall dataset and each of the two subsets corresponding to different lineages: overall/monocot/eudicot (A) overall/NAD-ME/NADP-ME (B). In (A) the variation between monocot and eudicot lineages is observed to be preserved when the overall transition networks are included, and on a similar quantitative scale to the variation in the overall set, embedded mainly on the first principal axis. In (B) the variation is of a similar scale but less distinct, correlating more with the second principal axis.