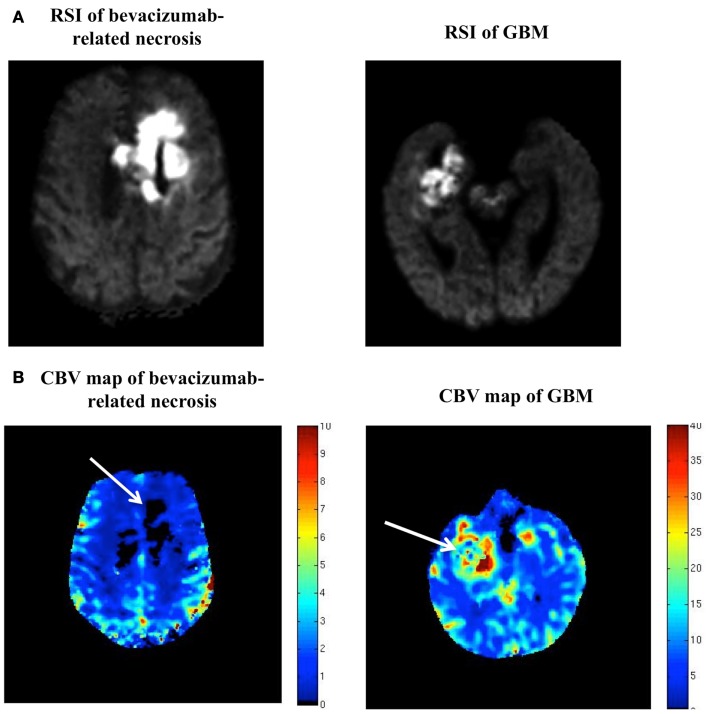
Figure 2.
(A,B) RSI and CBV maps in bevacizumab-related necrosis versus GBM. (A) is a side-by-side comparison of the RSI signal seen in our patient and the RSI signal seen in a typical GBM, with the two RSI images scaled identically (i.e., same window and level). (B) is a side-by-side comparison of the DSC MR perfusion-generated CBV map for this patient and the CBV map for the same patient with GBM shown in (A) (with adjacent color scales).

