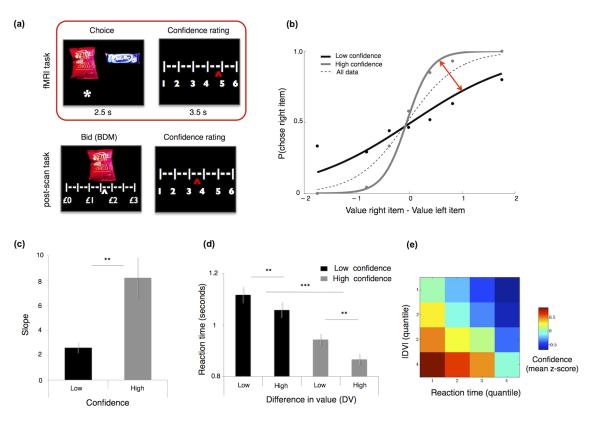
Figure 1. Task and behavioral results.
(a) fMRI task (red box): Subjects were presented with a choice between 2 confectionary items and were then required to choose (2.5 sec) one item to consume at the end of the experiment. After each choice, subjects indicated their level of confidence in having made a correct decision (choice confidence). Post-scanning task: Subjects were presented with each item individually and had to submit a bid to buy each item. After each bid, they were asked to rate their level of confidence in having provided a correct bid price (bid confidence). (b) Probability of choosing the item on the right as a function of the difference in value (i.e. bid price) between the 2 items (logistic fit) for an exemplar subject (see Figure S2 for all individual subjects). Dotted line = all choices; black line = low confidence choices; grey line = high confidence choices. The red arrow indicates the increase in choice accuracy (change in slope) for high versus low confidence trials used in the between subject analyses (Figure 4b and 5b) (c) The slope of the logistic fit is systematically higher (sharper) in high compared to low confidence trials (p<0.0001). (d) Average choice reaction time data as a function of confidence and ∣DV∣. (e) Heatmap showing mean z-scored confidence (colorbar) across subjects, as a function of subject-specific ∣DV∣ and RT quantiles. Error bars represent the standard error of the mean (s.e.m.).

