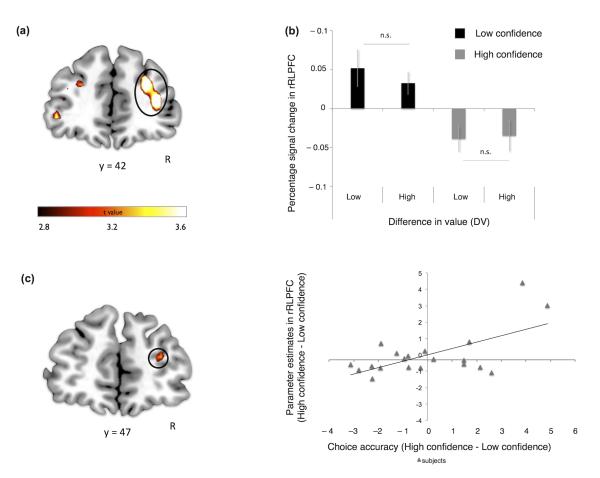
Figure 4. RLPFC.
(a) Brain activity in rRLPFC correlating with decreases in subjective confidence (p<0.005 small volume FWE corrected). (b) Signal in rRLPFC [6 mm sphere MNI space coordinates (x, y, z) 39, 41, 16] showing a main effect of confidence but not difference in value. Note that the bar plot (extracted from GLM2 – see Methods) is shown only to clarify the signal pattern in rRLPFC (i.e. absence of main effect of DV). (c) Between-subject regression analysis entering the change in choice accuracy (slope of the logistic fit) between low and high confidence trials (see red arrow in Figure 1b) as a covariate for confidence-related activity in rRLPFC [peak (x, y, z) 27, 44, 16; p<0.05 small volume FWE corrected]. Note that the scatter-plot is not used for statistical inference (which was carried out in the SPM framework), and is shown solely for illustrative purposes. Error bars represent the s.e.m.

