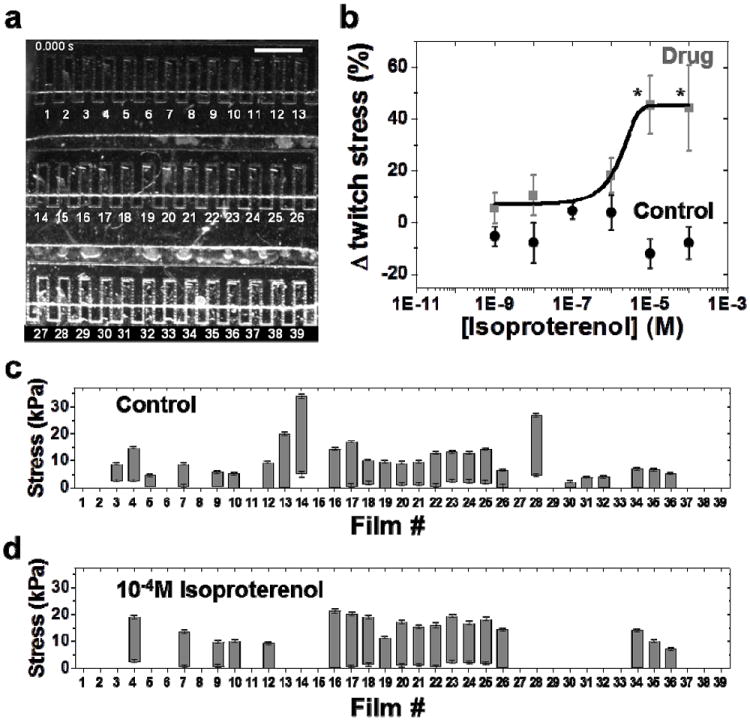
Figure 4.

Evaluation of the effect of isoproterenol on cardiac contractility. (a) Brightfield image of a higher throughput chip during drug dose response studies within the fluidic microdevice. Scale bar represents 1 mm. (b) Complete isoproterenol dose response curve (data points represented by gray squares) generated from the operation of one fluidic chip (N = 19 MTFs, Mean±SEM, * = statistically different from baseline, p < 0.05). Black circles represent the data points for control experiment to evaluate cardiac contractility in the absence of isoproterenol. Drug-free Tyrode’s solution is injected into the fluidic device at the same time points as for conducting drug dose response studies (N = 23 MTFs, Mean±SEM). (c) Baseline stresses (before exposure to isoproterenol) of individual MTFs. Minima, maxima and the length of the each bar graph represent the diastolic, peak systolic, and twitch stress generated by the corresponding MTF, respectively. Error bars for diastolic and peak systolic stress represent the standard deviation in the average measurement over four contraction cycles. (d) Stress generated by the same MTFs at the highest isoproterenol concentration of 10-4M.
