
Fig. 3.
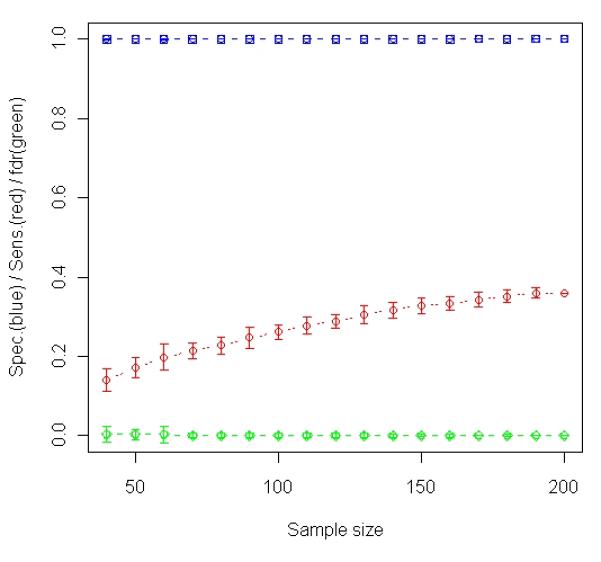
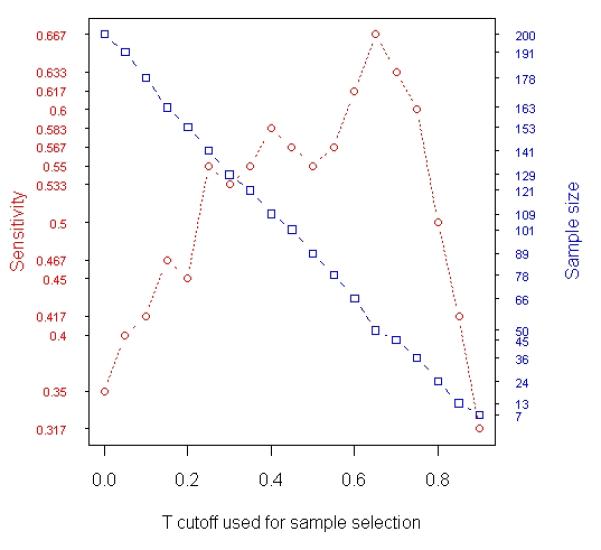
Analysis of simulated data. A total 1000 gene expression levels were simulated for each of 200 samples (100 relapses and 100 non-relapses). Among the 1000 genes, 60 were simulated to be relapse-associated signatures in tumor and the other 60 were simulated to be relapse-associated signatures in stroma. The simulated tumor percentage for these 200 samples varies from 1% to 98%. (a) Results of t-test based on averaging 100 random experiments in which subsets of samples were randomly selected from the entire population (200 samples). The curves in blue, red and green with error bars represent specificity, sensitivity and false discovery rate, respectively, at each particular sample size. (b) The changes in Sensitivity (red curve) and number of samples selected for t-test (blue curve) when different T cutoffs were used for sample selection (Stepwise Enrichment).