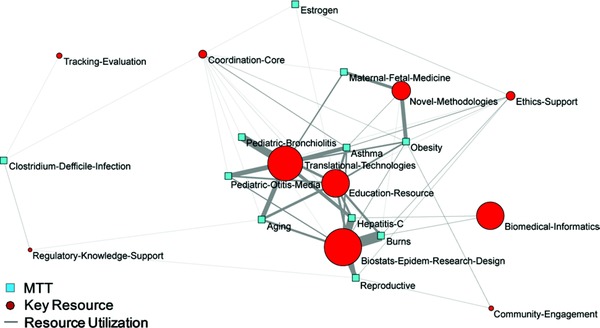
Figure 5.

CTSA Key Resource Utilization by MTTs. Shown is a bipartite network of 11 MTTs and 10 Key Resources. The size of the KR nodes is proportional to the total time spent with each MTT (shown by the thickness of the edges connecting each MTT and KR), plus the total time spent for general activities such as infrastructure building that are useful across MTTs. The Clinical Research Center Key Resource, heavily used by one MTT, obscured the network analysis and was excluded from the visualization.
