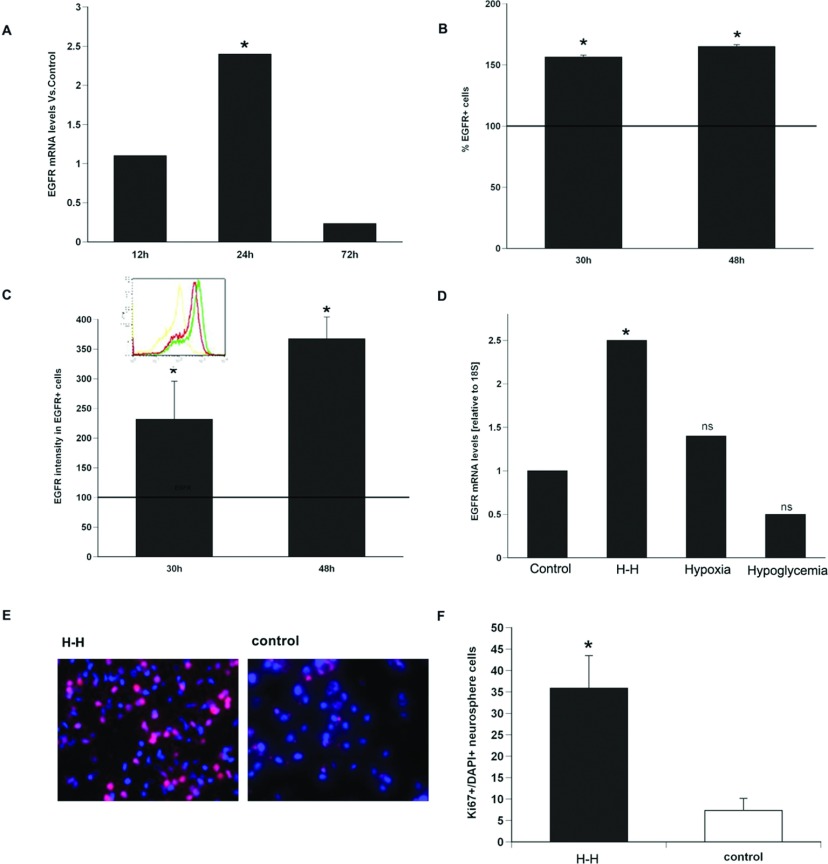
Figure 1. EGF-R induction and cell division can be recapitulated in vitro in the absence of a brain cell niche.
(A) Q-PCR using primers specific for EGF-R and normalized to expression of 18S at 12, 24 and 72 h after in vitro H–H on rat NPs. (B) Quantification of the EGF-R expressing cells and (C) EGF-R intensity within NPs at 30 and 48 h after in vitro H–H. (D) EGF-R mRNA at 24 h after exposure of NPs to only hypoxia (2% O2) or only ischemia (3 mM glucose) or a combination of both. Solid line indicates EGF-R levels thee in untreated control NPs. Values are average±S.E.M. from three independent experiment with n=6 animals per experiment.*=P<0.05 by REST (relative expression software tool). (E) NP were exposed to H–H, allowed to recover for 30 h and then labelled for Ki67 (red) and counterstained with DAPI (blue). (F) Quantification of % Ki67/total cells. Values represent mean±S.E.M.*P<0.5 by Student's t test.

