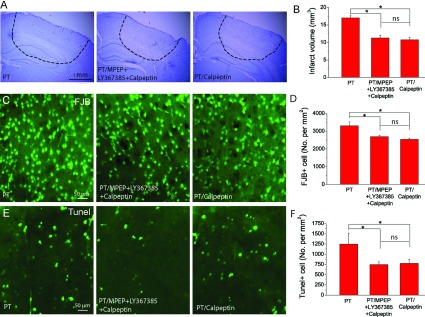
Figure 4. Effect of calpain inhibitor calpeptin on PT-induced brain infarction and neuronal death.

(A) Nissl stained images of brain sections from the regions with maximum infarction under different conditions, i.e. mice subject to PT (group 1, left), PT with administration of MPEP/LY367385/calpeptin (group 2, middle) and PT with administration of calpeptin (group 3, right). (B) Summary of infarct volumes. N=21 mice for group 1, N=4 mice for groups 2 and 3. (C,D) Representative images of FJB staining (C) and summary of the densities of FJB+ cell (D). (E,F) Representative images of TUNEL staining (E) and summary of the densities of TUNEL+ cell (F). N=4 mice for groups 1–3 in (D)–(F). *P<0.05, ns-no significant difference, ANOVA test.
