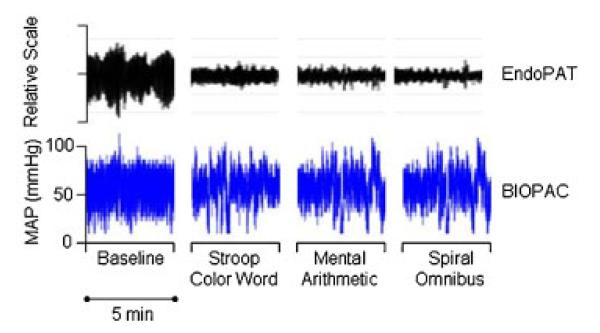
Figure 3.
An example tracing from one subject during one mental stress task is shown. The panel on the top shows the EndoPAT pulsatile volume tracing (relative scale) and the panel on the bottom shows the BIOPAC arterial blood pressure tracing for a 5-min baseline period, and 5-min segments of the Stroop colour word test, the mental arithmetic test and the spiral omnibus test.

