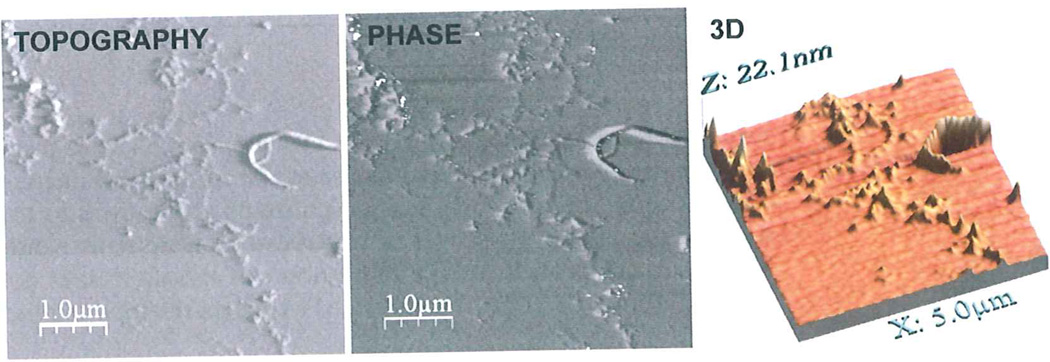
Fig. 1.
Schematic diagram illustrating the information contained in an intermittent-noncontact AFM scan of protein fibrils. Topography and Phase imaging layers of aggregates formed using a 1:1 mixture of rHaPrP wt and rHaPrP M206S–M213S under native conditions (9). 3D profile of the aggregates constructed with WSxM 5.0 after equalization and flattening.

