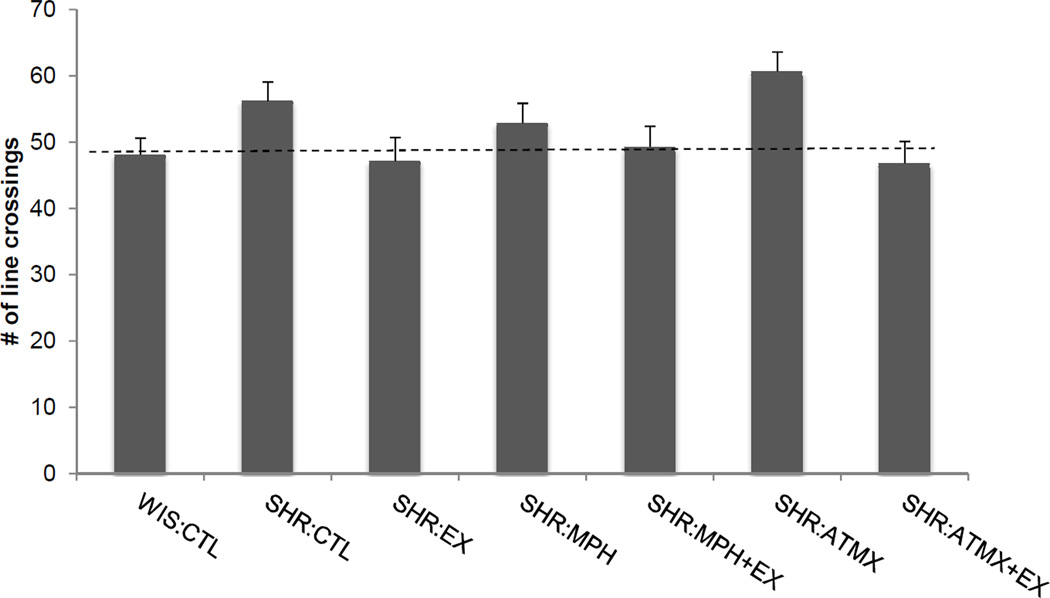
Figure 5.
Locomotor activity measured during the social interaction task in Experiment 1. Data reflect the number of times rats in each group crossed a line that separated the arena into thirds. There were no differences between any of the SHR groups and the WIS:CTL group. Data are means ± SEM (abbreviations as defined in Figure 1). Dashed line indicates the number of line crossing in the WIS:CTL group.

