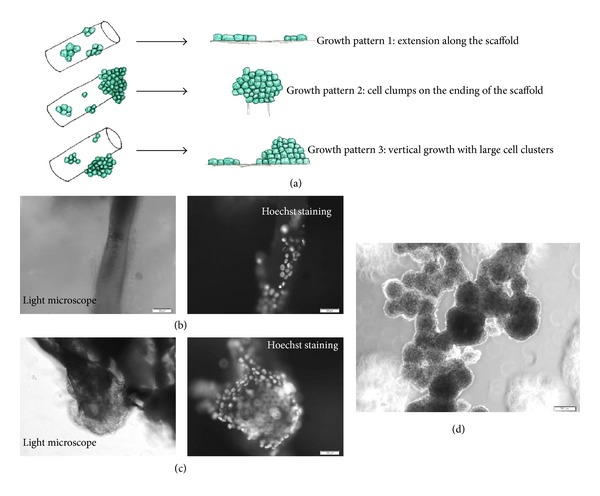
Figure 5.

(a) Illustration of three types of growth pattern on the scaffolds. (b) to (c) showing the identical microscopic view under light (left panel) and fluorescent filters (right panel); (b) an example of form A growth; (c) an example of form (b) and (c) vertical growth; (d) large cell clumps detached from scaffold grow as tumour spheroid. Scale bars are (b) and (c) = 50 μm, (d) = 200 μm.
