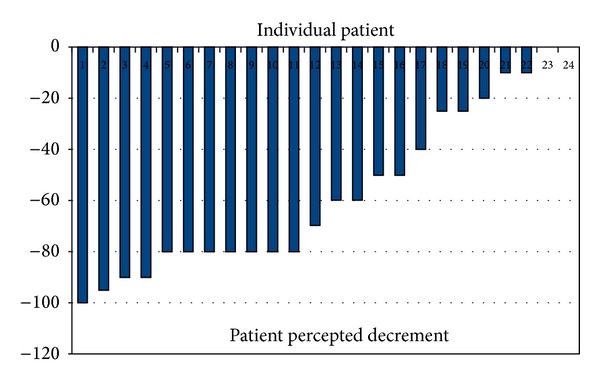
Figure 2.

Patient percepted decline in tumor swelling (primary tumor and not nodal). On x-axis are the individual patients and on y-axis is the tumor decline in percentage. Please note that if the tumor has decreased in size it has been charted along the negative values on y-axis.
