Figure 4.

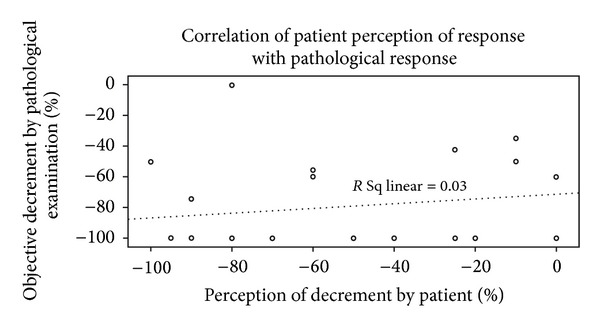
The scatter plot of the relation between % decrement in pathological specimen and % decrement in size of primary according to patients perception.

The scatter plot of the relation between % decrement in pathological specimen and % decrement in size of primary according to patients perception.