
Figure 2.
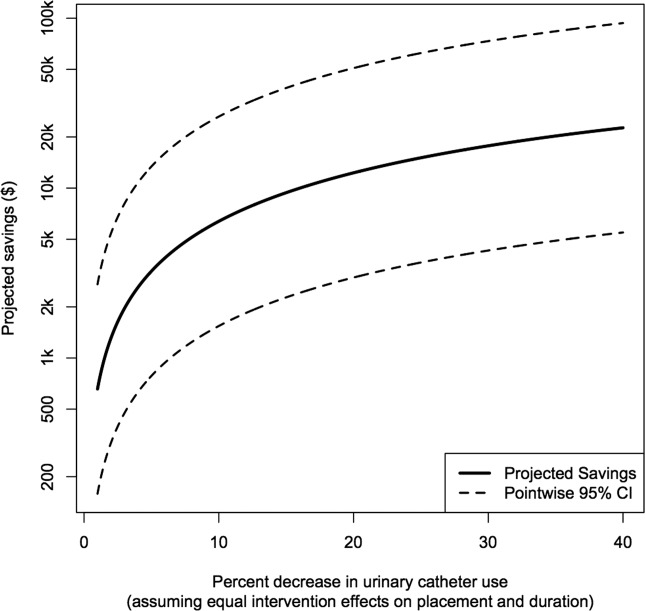
Projected cost savings for a hypothetical hospital projections were generated for a hypothetical hospital with 3000 total patients and 15% having urinary catheters (ie, 450 patients catheterized prior to intervention) and with default values given in Table 1. Abbreviations: CI, confidence interval.