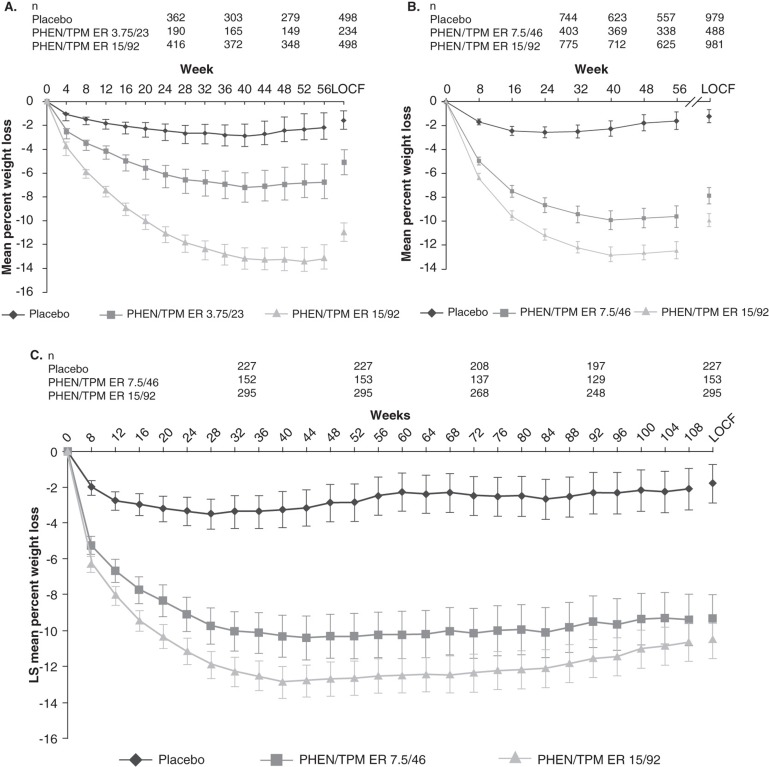
Figure 1.
Weight loss with phentermine/topiramate ER in (A) EQUIP, (B) CONQUER and (C) SEQUEL studies from baseline to study end [26,27,29]. Least-squares mean change (95% CI). Weight-change curves are plotted for completers by visit. (A) EQUIP Study from baseline to week 56. Shown to the right of the graph are data derived from the analyses of the ITT-LOCF. p < 0.0001 vs placebo for all time points assessed (adapted from Allison et al. [26]); (B) CONQUER Study from baseline to week 56. Shown to the right of the graph are data derived from the analyses of the ITT-LOCF. p < 0.0001 vs placebo for all time points assessed (adapted from Gadde et al. [27]); (C) SEQUEL Study from baseline to week 108. p < 0.0001 vs placebo for all time points assessed.
Adapted from Garvey et al. [29].
CI: Confidence interval; ITT-LOCF: Intent-to-treat, last observation carried forward; MI: Multiple imputation; PHEN/TPM ER: Phentermine/topiramate extended-release.

