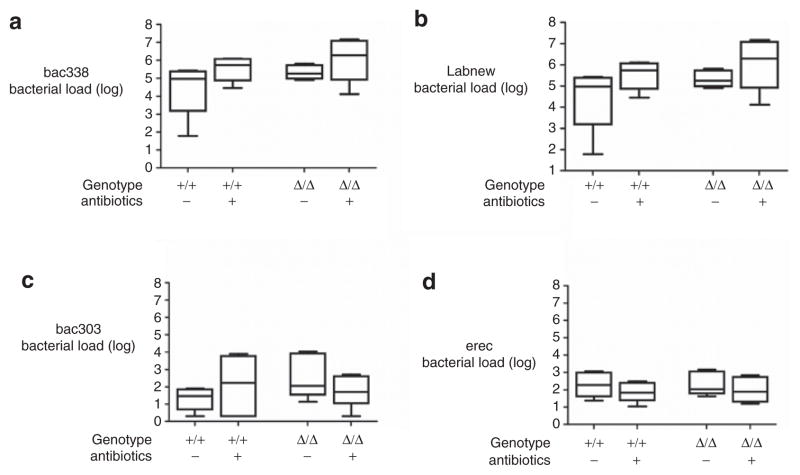
Figure 3.
Bacterial load in small intestine. Number of copies of the bacterial load in the small intestine in homozygous ΔF508 mice (Δ/Δ) and their wild-type (WT) littermates (+/+) after antibiotic (AB) or control treatment. Categories of bacterial groups: (a) Bac338, (b) Labnew, (c) Bac303, (d) Erec (Table 1). Box plot represents median and 25th and 50th centiles. Whiskers represent the lowest and highest values of the bacterial load.

