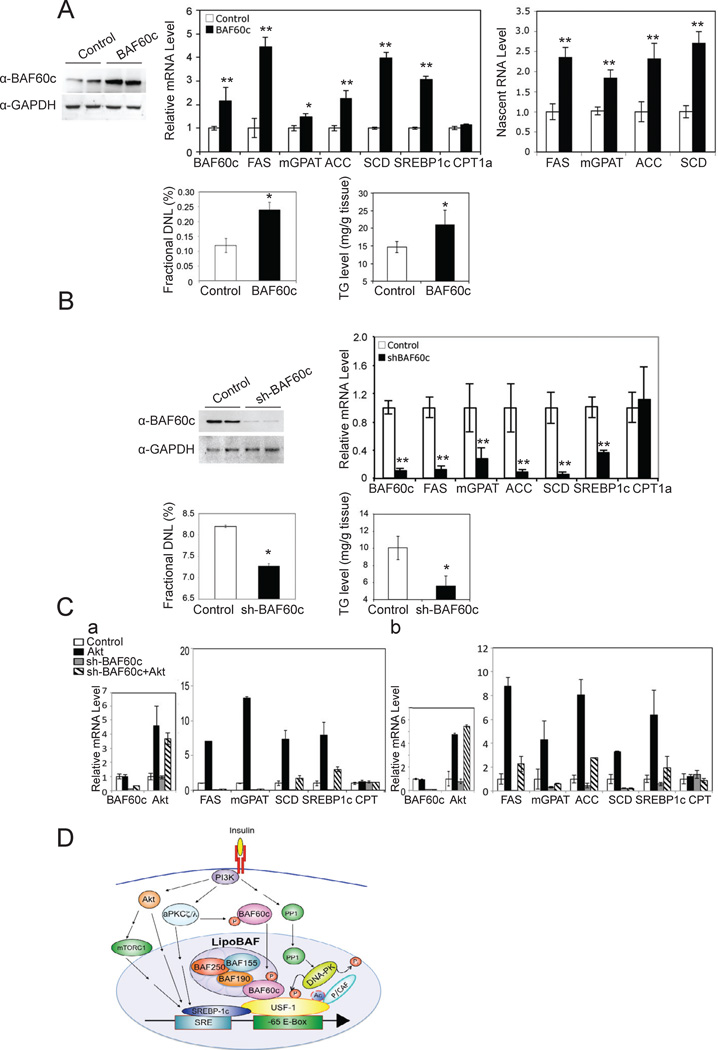
Figure 7. BAF60c promotes lipogenesis in vivo.
(A) BAF60c protein levels in livers of mice 14 days after tail vein administration of BAF60c adenovirus (top left). mRNA levels (top middle) and nascent RNA levels (top right). Percent of newly synthesized fatty acids in liver (bottom left) and hepatic triglyceride levels (bottom right). Means ± SEM. *p<0.05, **p<0.01, n=3–5. (B) BAF60c protein levels in livers from mice 14 days after tail vein administration of shBAF60c adenovirus (top left). Expression of lipogenic genes (top right), de novo lipogenesis (bottom left) and triglyceride levels (bottom right) in the liver. Means ± SEM. *p<0.05, **p<0.01, n=3–5. (C) Expression levels of BAF60c and Akt 10 days after tail vein injection of adenoviral shBAF60c and adenoviral Akt in livers of mice (a, left). Expression levels of lipogenic genes in livers (b, right), n=4. Expression levels of BAF60c and Akt in HepG2 cells infected with adenoviral shBAF60c and adenoviral Akt (b, left). Expression levels of lipogenic genes 72 hrs post-infection (a, right). Means ± SEM. (D) Insulin signaling pathway for posttranslational modifications of BAF60c and USF-1 in chromatin remodeling and activation of lipogenic genes.

