Figure 1.

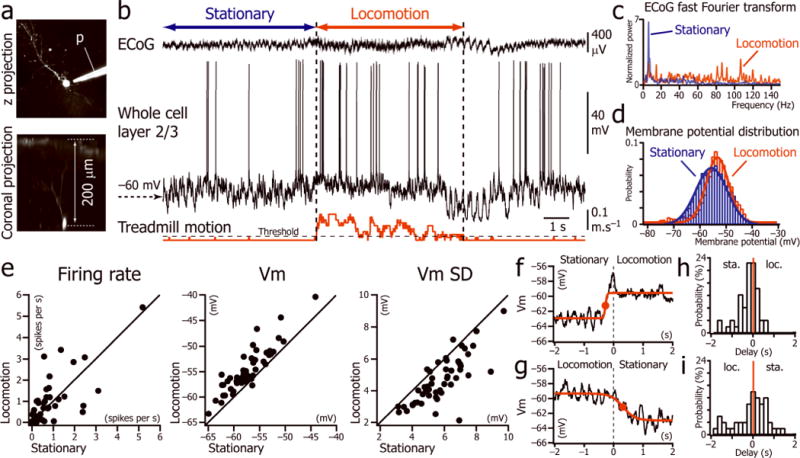
Spontaneous activity of L2/3 neurons during stationary and locomotion periods. (a) Two-photon images of a V1 L2/3 neuron labeled with Alexa-594 through the recording pipette (p). (b) Current-clamp recording of a L2/3 neuron (middle trace) simultaneously with V1 ECoG (top trace) and treadmill motion (bottom trace). Period of locomotion (between vertical dotted lines) defined as beginning when the velocity is greater than the first step of velocity detection (threshold) for more than 1s, and resuming when velocity is lower than threshold for more than 1s. (c) Fast Fourier transforms of the ECoG signal shown in bduring the periods labeled “stationary” and “locomotion”. (d) Distributions of the Vm fitted by Gaussian functions during the periods labeled “stationary” and “locomotion” in b. (e) Plots of the mean firing rate, the mean Vm and the Vm standard deviation (Vm SD) during stationary versus locomotion periods (n=53 neurons from 36 mice). (f, g) Vm averages triggered by the beginning (f) and the end (g) of 62 locomotion episodes in one neuron. Times at half rise (red dots)of the sigmoid fits were used to determine the delay between the Vm depolarization and the beginning and end of locomotion episodes. (h, i) Distribution of delays between depolarization and beginning of locomotion (loc.) (h); and repolarization and immobility (sta.) (i) for all the neurons (n= 53 from 36 mice).
