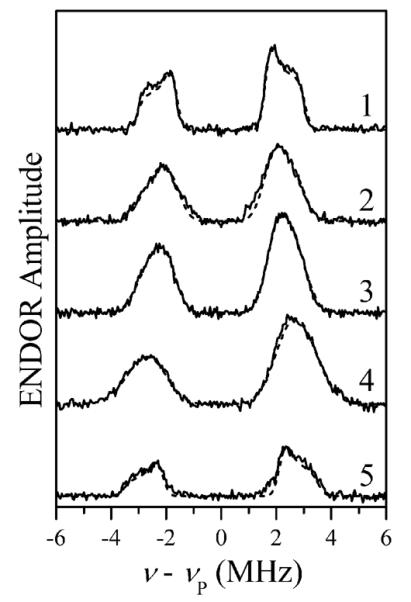
Figure 3.

Solid traces, refocused Mims ENDOR spectra of myosin·Mn·AMPPNP (trace 1), Mn·AMPPNP (trace 2), Mn·ATP (trace 3), Mn·ADP (trace 4), and myosin·Mn·ADP·AlF4 (trace 5). The spectra were normalized by the ESE signal amplitudes without RF. Experimental conditions: νmw = 30.108 GHz (traces 1–4) and 30.136 GHz (trace 5); Bo = 1070.3 mT (traces 1–4) and 1072.8 mT (trace 5); mw pulses, 8, 8, 8, and 14 ns; time interval between the first and second mw pulses, τ = 80 ns; time interval between the second and third mw pulses, T = 25 μs; time interval between the third and fourth (refocusing) pulses, t = 380 ns; RF pulse, 22 μs; temperature, 15 K. Dashed traces superimposed on the solid traces are simulated with parameters shown in Table 1.
