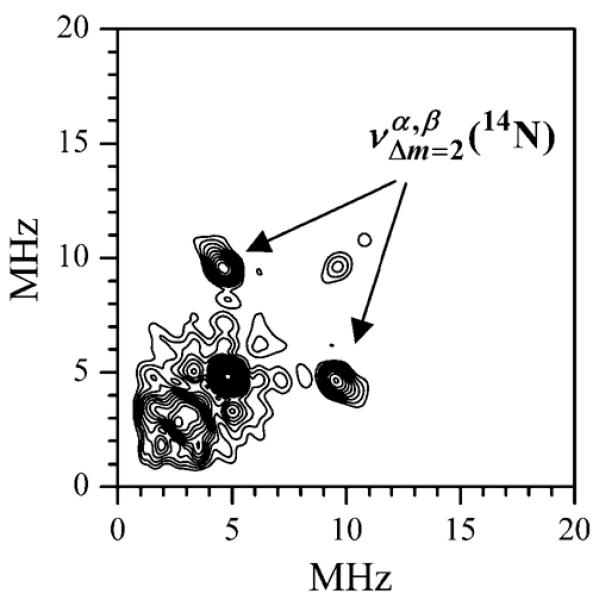
Figure 6.

HYSCORE spectrum of Mn·ADP. Experimental conditions: νmw = 30.108 GHz; Bo = 1070.3 mT; mw pulses: 8, 8, 15, and 8 ns; temperature, 15 K. The spectrum represents the sum of the spectra obtained at time intervals between the first and second mw pulses τ = 120, 150, and 180 ns. The correlation features is indicated.
