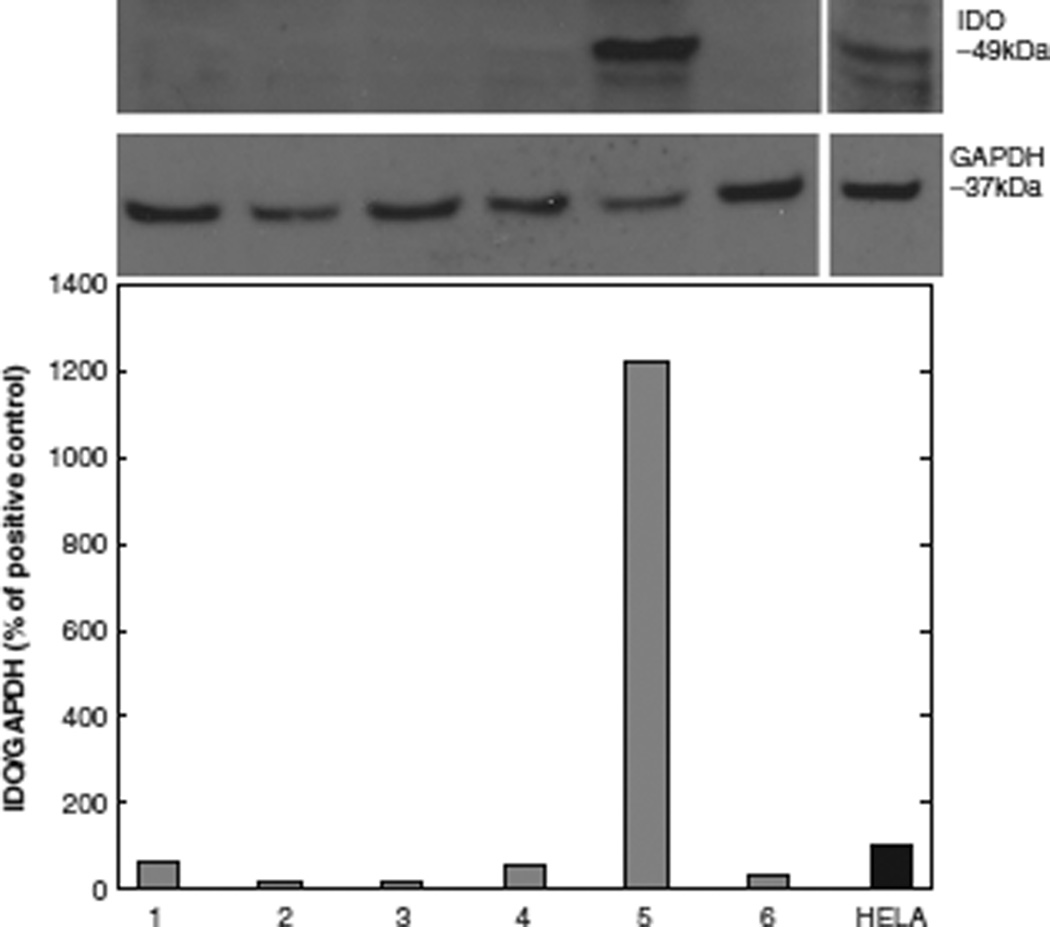
Figure 1.
IDO protein expression in DC after polarizing and non-polarizing culture conditions (unpolarized, 1, 2, 3, 4, 6; polarized, 5), expressed as an IDO/GAPDH ratio as the percentage of positive control (IFN-γ-stimulated HeLa cells = 100%). Western blot IDO protein expression was measured densitometrically. Mean values of two healthy donors are shown as bar graphs. A representative immunoblot is shown above the graph for IDO and GAPDH loading control.

