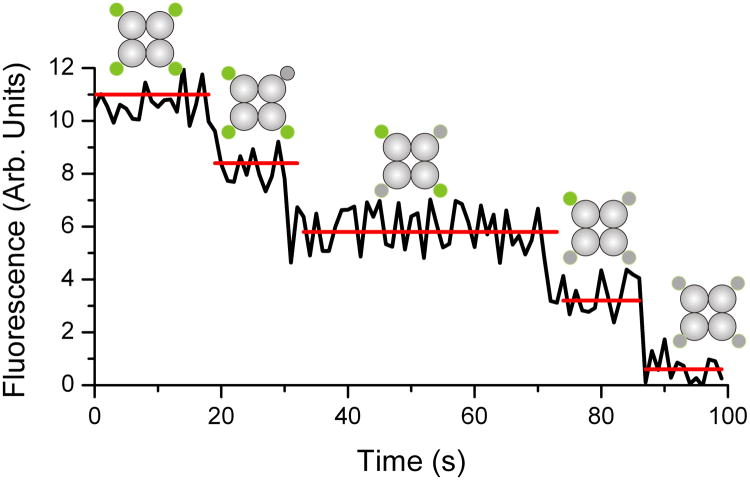
Figure 1.
The single-molecule subunit counting method. The figure is a hypothetical plot of the fluorescence intensity of a single tetrameric molecule, as a function of time, with each subunit covalently linked to a fluorophore, under continuous excitation sufficient to cause bleaching of the fluorophores. The fluorescence decreases in approximately equal amplitude steps unit background levels are reached. The molecular diagrams indicated the number of active fluorophores (depicted in green) at each stage. The number of steps (in this case four) yields the stoichiometry of the molecule.

