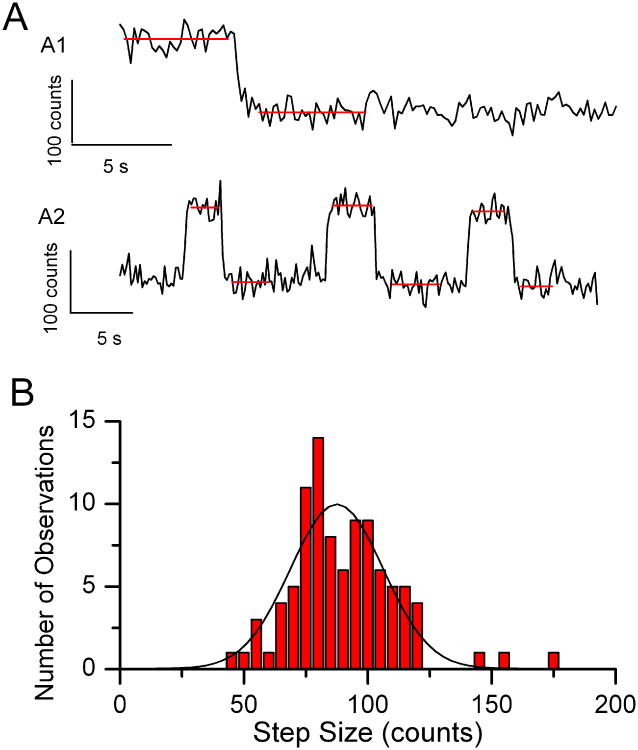
Figure 5.
Analysis of single molecule Alexa Fluor 488 images. A) Examples of time plots of single molecule Alexa Fluor 488 fluorescence. Red lines indicate computed averages before and after each bleaching event. The scale bars represent 5 s (time) and 100 counts (amplitude). B) Histogram of 95 observed fluorescence step decreases in a single Alexa Fluor 488 experiment. The fitted Gaussian distribution parameters are xc = 87.49, w = 37.48, A = 467.13 (R2 = 0.86). Adapted from Hallworth & Nichols (2012).

