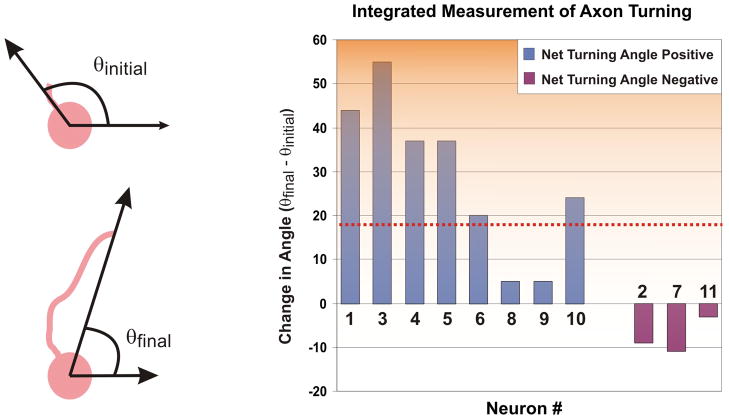
Fig. 3.
Angular Difference of Axon Tip between End-Points: Bar graphs plotting the change in the angle of the axon tip (as measured from the centroid of the cell body, with respect to the gradient direction along the positive y-axis) between the end-points of the experiment. The neurons are grouped according to whether they had a net positive (left 8 “blue” bars) or negative (right 3 “purple” bars) turning angle. The red dotted line represents the mean (18.7°) angle (p < 0.05 using Student’s t-test).

