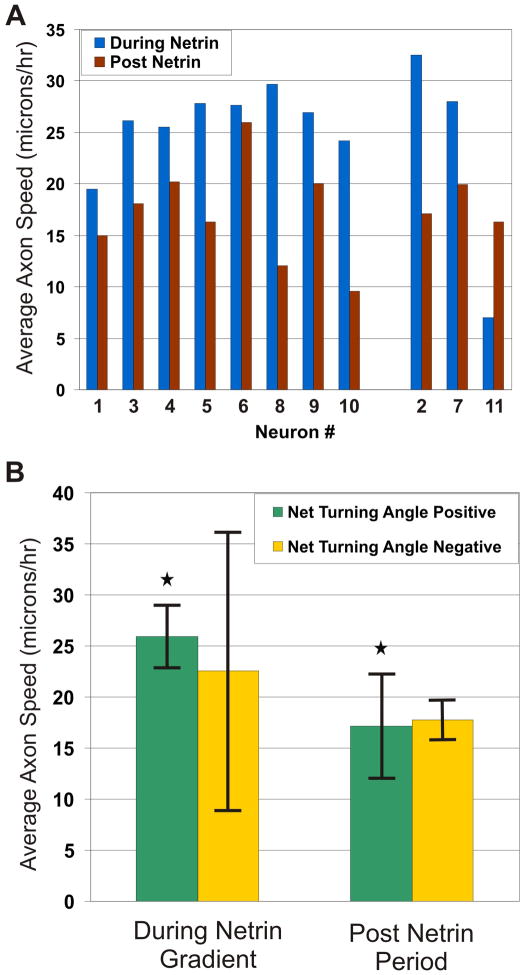
Fig. 4.
Netrin as a Growth Factor: (A) Bar graph plotting the average speed of all the individual axons during netrin gradient application (blue) and after the removal of the gradient (red). The neurons are grouped into ones that had a net positive turning angle (left 8 bars) and ones that had a net negative turning angle (right 3 bars), as determined from Fig. 3 (B) Bar graphs plotting the average normalized speed of the axon tips (magnitude of the axon growth velocity vector) during netrin gradient application, after removal of the gradient, plotted separately for the axons that turned in the direction of the gradient (green, n = 8) and the ones that turned away from it (yellow, n = 3). Error bars in the graph correspond to one standard error above and below the average. * = p-value < 0.05, using non-parametric paired, two-sided, signed-rank Wilcoxon test.

