Fig. 5.
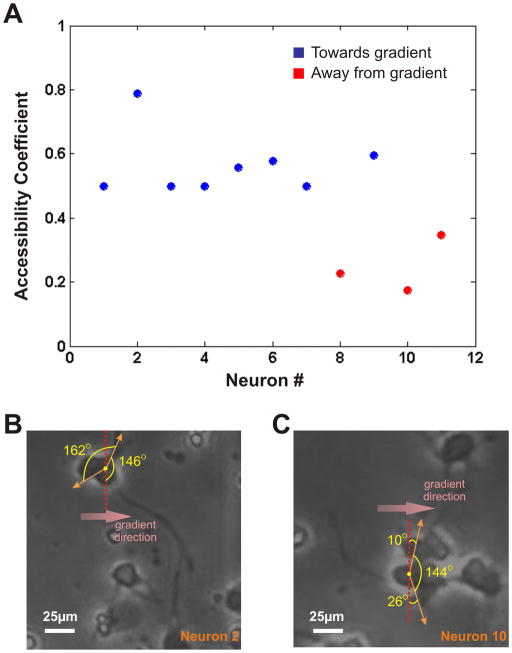
Axonal Responses in the Direction of the Gradient Source: (A) Plot of the accessibility coefficient (defined as the ratio of the angular spread of contact-free cell body perimeter on the source-facing side of the cell to the total angular spread of contact-free cell body perimeter) of all the neurons responding to netrin. Blue circles denote the neurons that had axons growing towards the direction of the gradient, whereas the red circles denote the neurons that had axons turning away from the gradient. (B) and (C) Schematics of the accessibility coefficient calculations for sample neurons growing with the final position of their axon tips in the half facing the gradient (#2) and the half facing away from the gradient (#10). Scale Bar = 25 μm.

