
Figure 3.
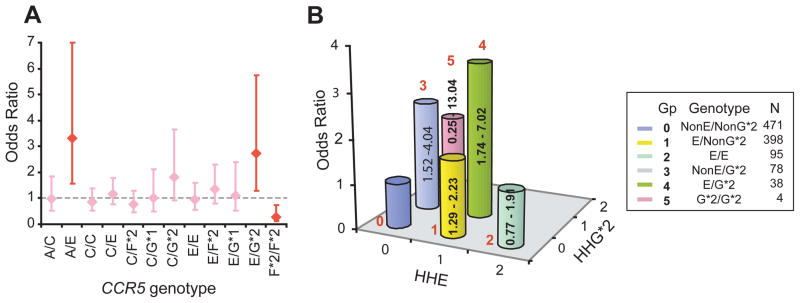
CCR5 genotypes and risk of systemic lupus erythaematosus (SLE). A. Association between the 12 most common CCR5 genotypes and risk of developing SLE. The diamonds and error bars represent point and 95% confidence intervals of odds ratio, respectively. Red indicates statistical significance while pink indicates statistical non-significance. B. Interactive effects of CCR5 human haplogroup (HH)E and HHG*2 on the risk of developing SLE. The numbers in red indicate the six color-coded genotypic groups; n, number of subjects in each group (Gp). For example, those who possess HHE but not HHG*2 are designated as E/NonG*2. For this analysis, group 0 (those lacking HHE and HHG*2) was considered as the reference category. The height of the bar indicates the odds ratio of developing SLE and the numbers in the bar indicate 95% CI.