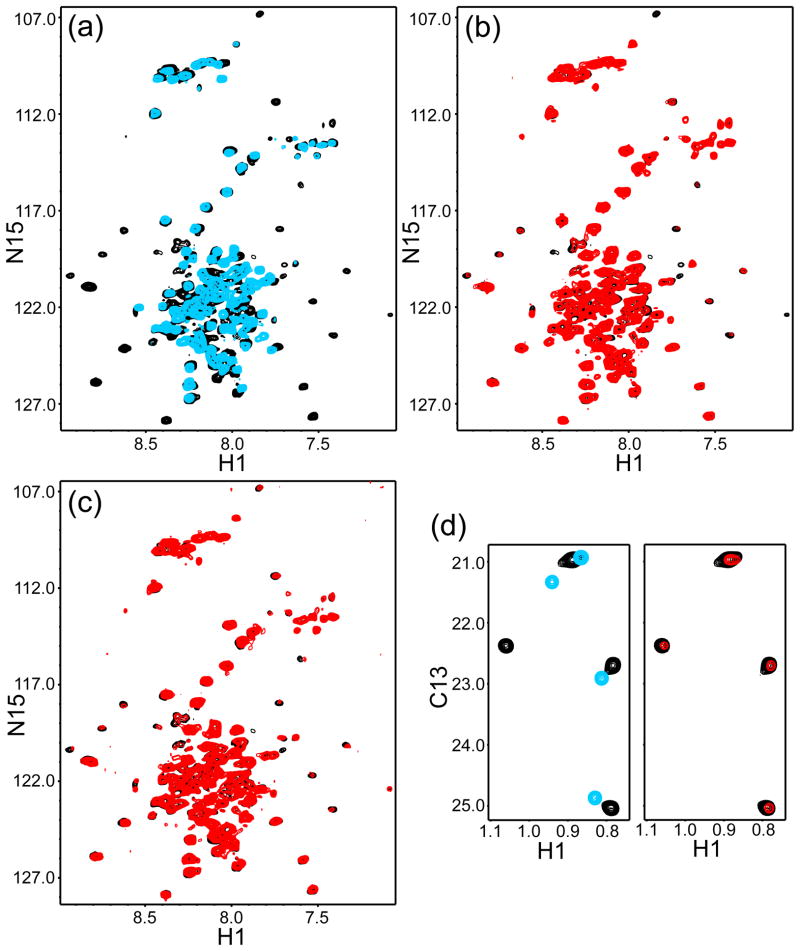
Figure 3.
Binding of the synaptotagmin-1 C2AB fragment does not perturb the binding mode of complexin-1 on the SNARE complex. (a) 1H-15N TROSY-HSQC spectra of 40 μM 2H,15N-labeled complexin-I in 1 mM EDTA and in the absence (blue contours) or presence (black contours) of 60 μM SNARE complex. (b,c) 1H-15N TROSY-HSQC spectra of the same sample containing 40 μM 2H,15N-labeled complexin-I and 60 μM SNARE complex in 1 mM EDTA (black contours), and of samples that contained 33 μM 2H,15N-labeled complexin-I, 50 μM SNARE complex and 50 μM eC2AB fragment in 1 mM EDTA (panel b, red contours) or 12 μM 2H,15N-labeled complexin-I, 18 μM SNARE complex and 18 μM eC2AB fragment in 1 mM Ca2+ (panel c, red contours). (d) 1H-13C HMQC spectra of 30 μM 2H-LV-13CH3-Cpx26-83 (blue contours), 15 μM 2H-LV-13CH3-Cpx26-83 plus 18 μM SNARE complex (black contours) and 10 μM 2H-LV-13CH3-Cpx26-83 plus 12 μM SNARE complex and 15 μM eC2AB fragment in 1 mM Ca2+ (red contours). In (b–d), contour levels were adjusted to correct for differences in the concentrations of 2H,15N-labeled complexin-I or 2H-LV-13CH3-Cpx26-83, and in the number of scans.

