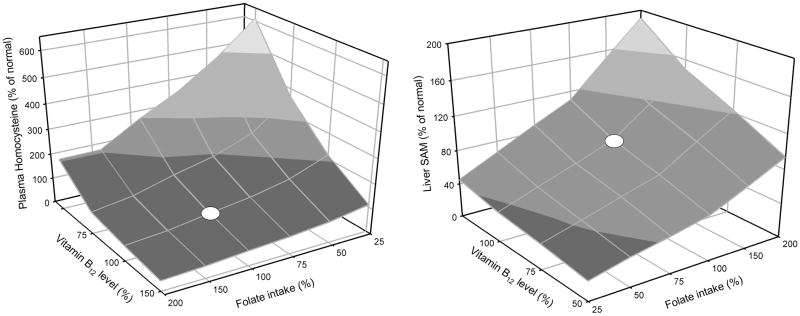
Figure 8.
Simulation of effect of simultaneous variation in folate intake and vitamin B12 status on plasma homocysteine and liver SAM. Values represent % of normal. For folate normal is the pre-fortification intake. Variation in vitamin B12 was modeled by varying the Vmax of methionine synthase in liver and tissue. White dots indicate pre-fortification values of folate intake and normal vitamin B12 status.

