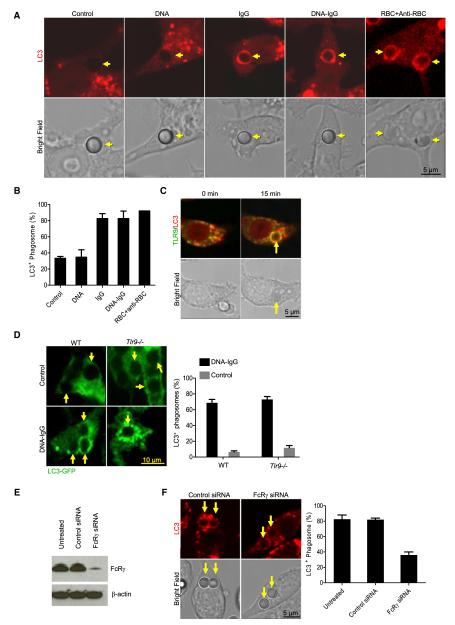
Figure 3. LC3 Colocalizes with TLR9 in IgG-Opsonized Phagosomes.
(A) Raw 264.7 cells expressing LC3-mCherry were allowed to ingest uncoated polystyrene beads (Control) or polystyrene beads coated with double-stranded DNA (DNA), anti-DNA IgGs (IgG), or a combination of both (DNA-IgG). RBC opsonized with RBC antibodies (RBC+Anti-RBC) were used as control. Engulfed beads were followed by time lapse confocal microscopy and representative frames taken 15 min after bead internalization are shown. Yellow arrows point to internalized beads. Scale bar represents 5 μm.
(B) The percentage of phagosomes that were positive for LC3 upon particle ingestion were quantified for three independent experiments (n ≥ 75 phagosomes per group). Data are presented as mean ± SD.
(C) Mouse macrophages expressing TLR9-GFP (green) and LC3-mCherry (red) were exposed to IgG-opsonized RBCs and engulfed particles were visualized by time lapse confocal microscopy. Representative frames from cells before and 15 min after particle internalization are shown. Yellow arrows point to internalized particles. Scale bar represents 5 μm.
(D) Bone marrow-derived pDCs from WT and Tlr9−/− mice expressing LC3-GFP were allowed to ingest uncoated polystyrene beads (Control) or polystyrene beads coated with a combination of CG50 plasmid DNA and DNA antibody E11 (DNA-IgG). Engulfed beads were followed by time-lapse confocal microscopy and representative frames taken 30 min after bead internalization are shown. Yellow arrows point to internalized beads. The percentage of phagosomes that were positive for LC3 upon bead ingestion were quantified for three independent experiments (n ≥ 75 phagosomes per group). Data are presented as mean ± SD. Scale bar represents 10 μm.
(E and F) Raw 264.7 cells expressing LC3-mCherry were treated with siRNA oligonucleotides targeting FcRγ. Nontargeting siRNA was used as control. FcRγ expression was assessed by immunoblotting 48 hr after the cells were treated with siRNA (E). siRNA-treated cells were allowed to ingest polystyrene beads coated with DNA-IgG. Engulfed beads were followed by time lapse confocal microscopy and representative frames taken 15 min after bead internalization are shown. Yellow arrows point to internalized beads. The percentage of phagosomes that were positive for LC3 upon bead ingestion were quantified for three independent experiments (n ≥ 75 phagosomes per group). Data are presented as mean ± SD. Scale bar represents 5 μm.

