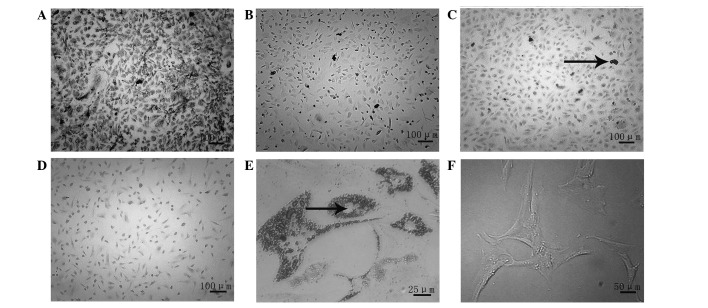
Figure 2.
Osteogenic and adipogenic induction demonstrated by staining. Osteogenic induction at 2 weeks in the (A) experimental and (B) control groups [alkaline phosphatase (ALP) staining; magnification, ×100]. Osteogenic induction at 4 weeks, in the (C) experimental and (D) control groups (Alizarin Red staining; magnification, ×100). The arrow indicates calcified nodules. (E) Adipogenic induction at 2 weeks in the experimental group (Oil Red O staining; magnification, ×400). The arrow indicates fat droplets. (F) Adipogenic induction at 2 weeks in the control group (magnification, ×200).

