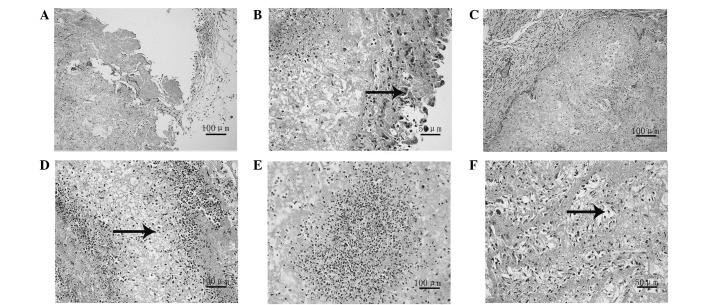
Figure 4.
Observation of cellular morphology through hematoxylin and eosin (H&E) staining. (A and B) Cell morphology at two days (magnification, ×200 and ×400 respectively). The arrow indicates the cells on the silk fibroin-chitosan scaffold (SFCS) surface. (C) Morphology at six days (magnification, ×200); (D) morphology at eight days (magnification, ×200). The arrow indicates the cells moving into the interior of the scaffold. (E and F) Cell morphology at ten days [magnification, ×200 and ×400, respectively). The arrow indicates the cell distribution in the porous scaffold.

