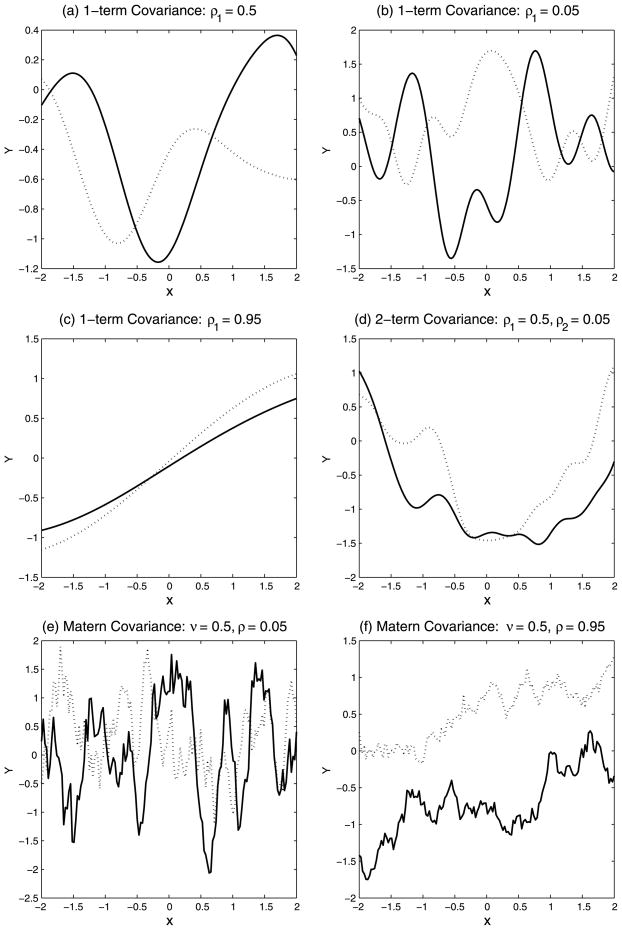
Fig. 1.
Response curves drawn from a GP. Each plot shows two (solid and dashed) random realizations. Plots (a)–(c) were obtained with the exponential covariance (7) and plot (d) with the 2-term formulation (8). Plots (e) and (f) show realizations from the matern construction. All curves employ a one-dimensional covariate.

