
Fig. 2.
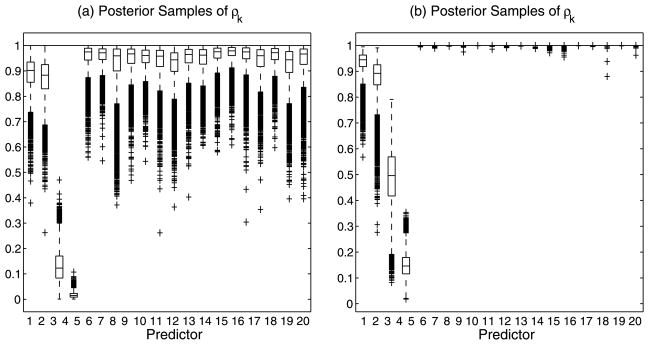
Use of variable selection parameters: Simulated data (n = 80, p = 20). Box plots of posterior samples for ρk ∈ [0, 1]. Plots (a) and (b) demonstrate selection without and with, respectively, the inclusion of the selection parameter γ.
Official websites use .gov
A
.gov website belongs to an official
government organization in the United States.
Secure .gov websites use HTTPS
A lock (
) or https:// means you've safely
connected to the .gov website. Share sensitive
information only on official, secure websites.
Use of variable selection parameters: Simulated data (n = 80, p = 20). Box plots of posterior samples for ρk ∈ [0, 1]. Plots (a) and (b) demonstrate selection without and with, respectively, the inclusion of the selection parameter γ.