Figure 1.

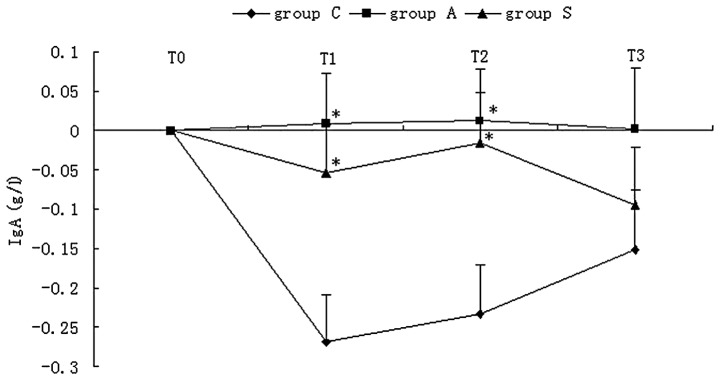
Variations in blood IgA level after anesthesia were compared among the three groups. *Compared with group C, there was a significant difference between group C and group A or group C and group S (P<0.05).

Variations in blood IgA level after anesthesia were compared among the three groups. *Compared with group C, there was a significant difference between group C and group A or group C and group S (P<0.05).