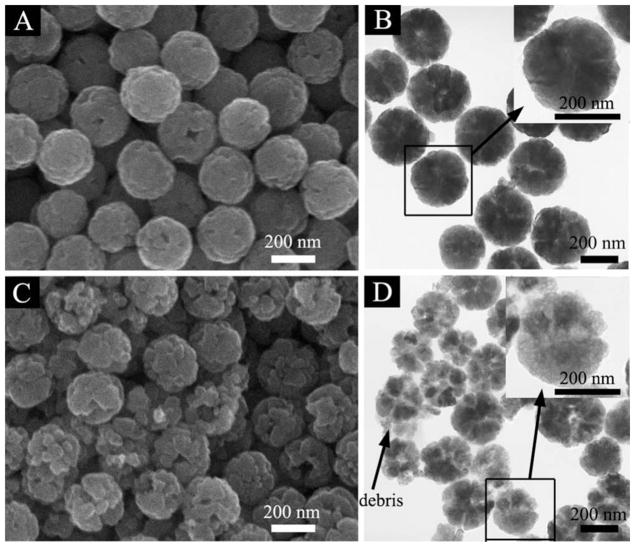
Fig. 1.
SEM (A,C) and TEM (B,D) images of IONPs. (A,B) As-synthesized s-IONPs; (C,D) m-IONPs, produced by PAA etching of the s-IONPs. Insets in B and D, higher magnification of a typical nanoparticle showing the difference in porosity before and after PAA etch. Left arrow in D indicates nanoparticles debris formed during the etching process.

