
Fig. 2.
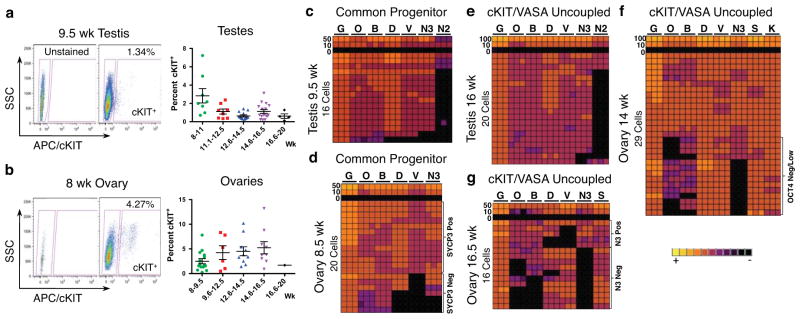
Molecular characterization of cKIT+ PGCs from 7–20 developmental weeks. (a,b) Gating strategy for sorting cKIT+ cells with an APC conjugated anti-human cKIT primary antibody against side scatter (SSC). (a) Shown is a 9.5-week testis and (b) an 8-week ovary. Also shown is the percent of cKIT+ cells sorted from the live fraction of testes in (a) and ovaries in (b) at 8–20 developmental weeks (wk). Each data point represents a single sample (biological replicate). All data are represented as mean ± SEM. (c–g) Heat map of GAPDH (G), OCT4 (O), BLIMP1 (B), DAZL (D), VASA (V), NANOS3 (N3), cKIT (K) NANOS2 (N2) and SYCP3 (S) in triplicate (columns) in 100, 50, 10, 0 or single sorted cKIT+ cells (rows).