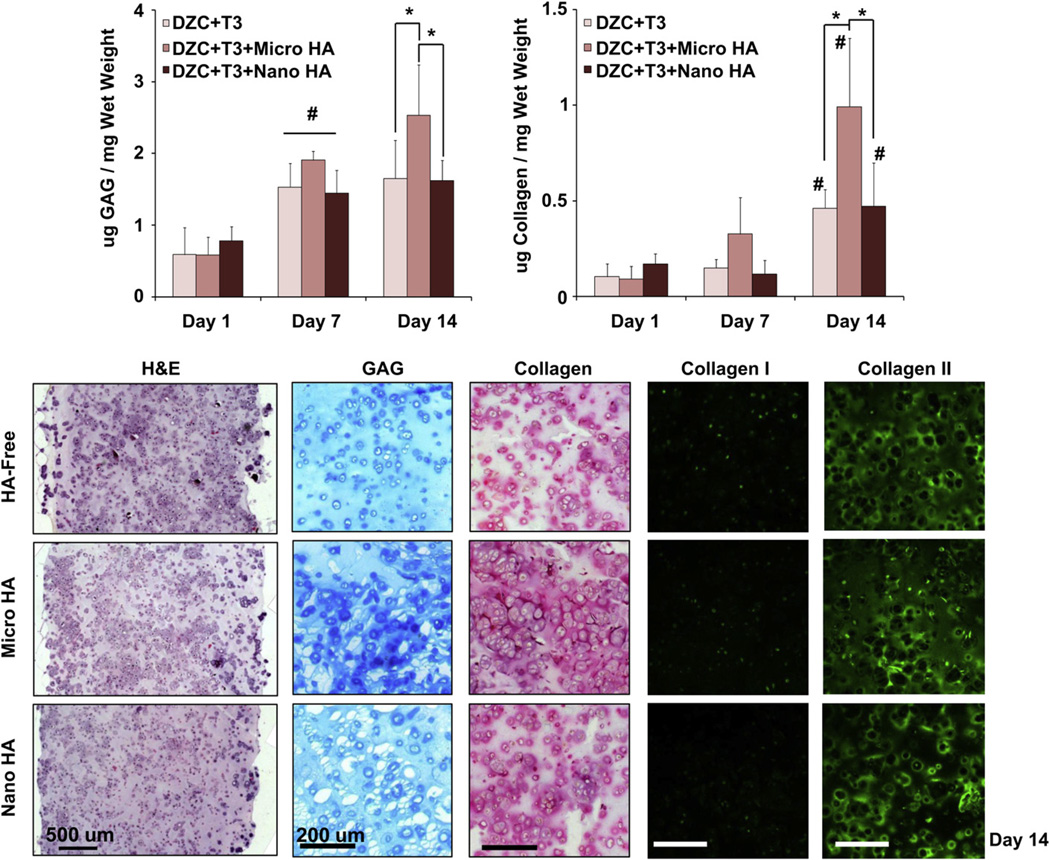
Fig. 3.
Effect of HA presence and size on hypertrophic chondrocytes: biosynthesis. Both GAG and collagen content were significantly higher at day 14 for the micro-HA group (*p < 0.05, n = 5). Corresponding histology reveals strongly positive matrix staining for the micro-HA group (Alcian Blue for GAG and Picrosirius Red for collagen, 10x, bar = 200 µm, day 14, n = 2). More specifically, strongly positive collagen II staining and minimal collagen I staining, was observed for all groups (immunohistochemistry, 10x, bar = 200 µm, Day 14, n = 2).

