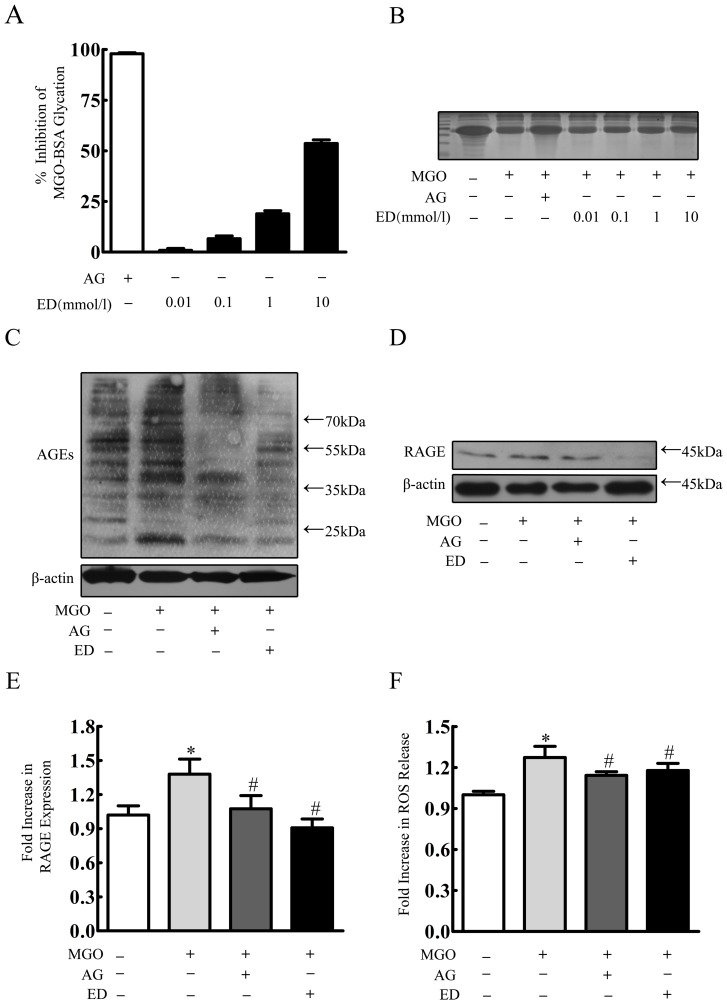
Figure 3. Edaravone inhibited MGO-induced AGE-RAGE axis and cellular oxidative stress.
(A) BSA-MGO assay. (B) The modulation of MGO-mediated BSA modification as revealed by SDS-PAGE. Results are means ± S.D. (C, D, E) HBMEC were incubated with edaravone (100 µmol/l), aminoguanidine (1 mmol/l) 20 min before MGO (2 mmol/l) treatment. After 24 h MGO treatment, RAGE, AGEs were determined by Western blotting. (F) HBMEC were incubated with edaravone (100 µmol/l), aminoguanidine (1 mmol/l) 20 min before MGO (2 mmol/l) treatment. After 24 h MGO treatment, cellular oxidative stress was determined by ROS release. *p<0.05 versus control group. #p<0.05 versus MGO group. n = 3 repeats. AG represented aminoguanidine. ED represented edaravone.

