
Figure 1. ROI selection.
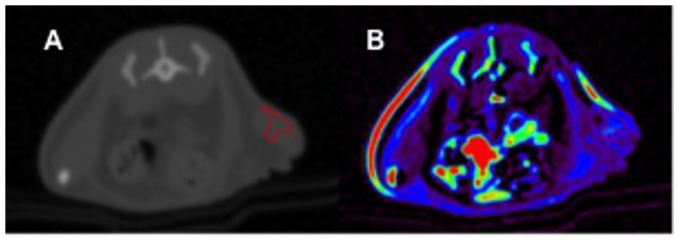
Axial contrast-enhanced CT of an animal after 7 days of regorafenib monotherapy (A). Note the subcutaneous tumor xenograft in the left lateral flank. For measurements of tumor microperfusion, a ROI (red lined area) was drawn using semiquantitative AUC maps (B). Note the right lateral flank colored red due to a skinfold artifact.