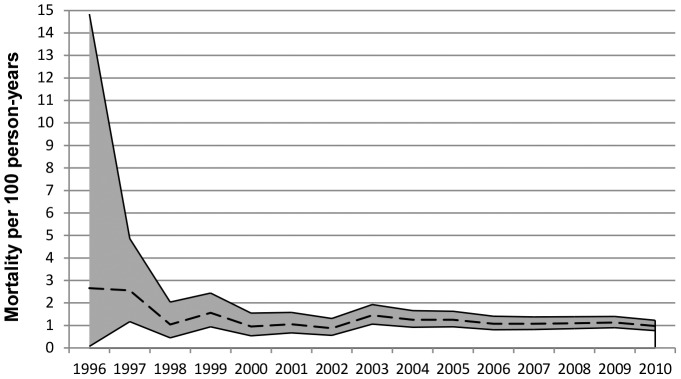
Figure 2. Mortality rate per 100 person-years.

The black dotted line is the mortality rate; the grey shaded area represents the 95% confidence-intervals.

The black dotted line is the mortality rate; the grey shaded area represents the 95% confidence-intervals.