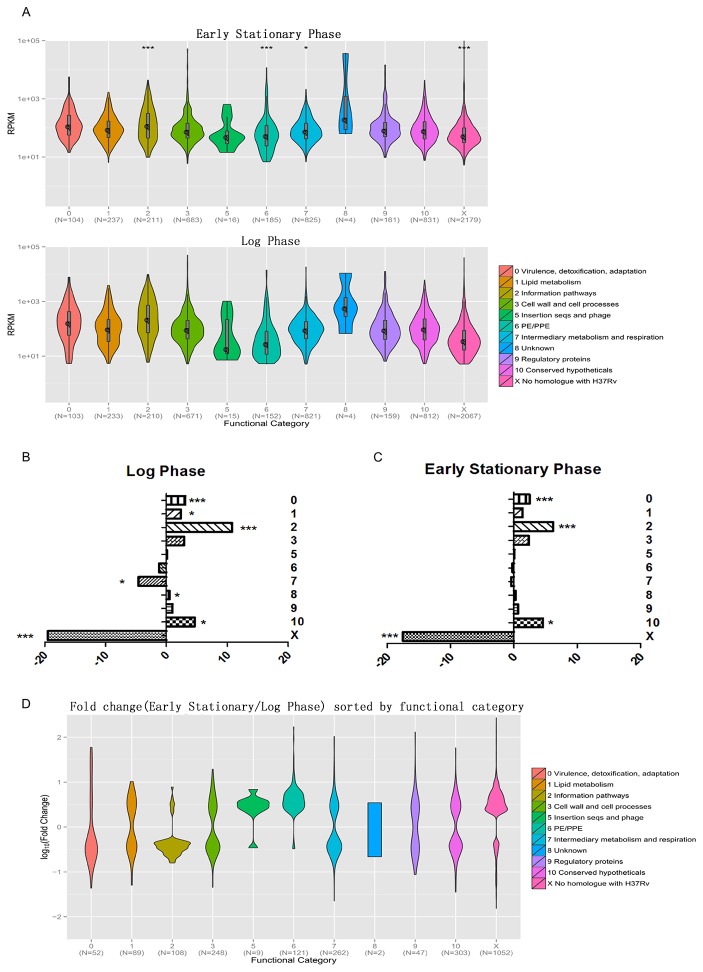
Figure 2. Representation of functional categories in log- and early stationary phase transcriptome.
(A) Genes of M.m were grouped according to their homologs in M.tb. Numbers on the x-axis indicates 11 categories and gene numbers contained in each category. Numbers on the y-axis represents RPKM values. RPKM values of each category were analyzed between two samples using Wilcoxon test. * p<0.05, *** p<0.001. (B and C) Values on the x-axis indicate the difference in percentage; positive values indicate over-representation of a particular category compared to the percentage observed in the annotated genome whereas negative values represent under-representation. (B) Difference in percentage of selected categories of top 10% log phase transcripts (n=525, Fisher’s exact test). (C) Difference in percentage of selected categories of top 10% early stationary phase transcripts (n=544, Fisher’s exact test). (D) Genes with significant changes (fold change>2, q value<0.001) were grouped.

