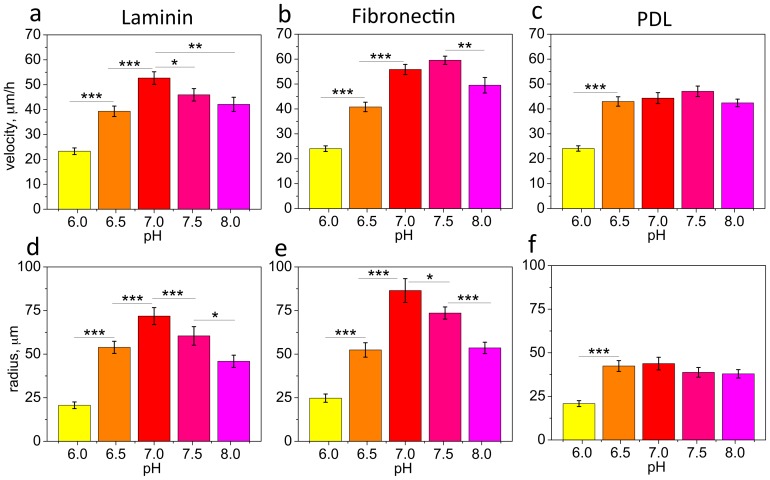
Figure 1. Migration velocity and migration radius of OPCs decreases at acidic pH.
(a, d) laminin (10 µg/ml), (b, e) fibronectin (10 µg/ml), and (c, f) PDL surfaces (50 µg/ml). Shown are mean values for N = 60 cells per pH condition. (a–f) Error bars are SEM; * p<0.05, ** p<0.01, *** p<0.001. Colors correspond to cell media pH, representing schematically the colors on a pH indicator strip.

