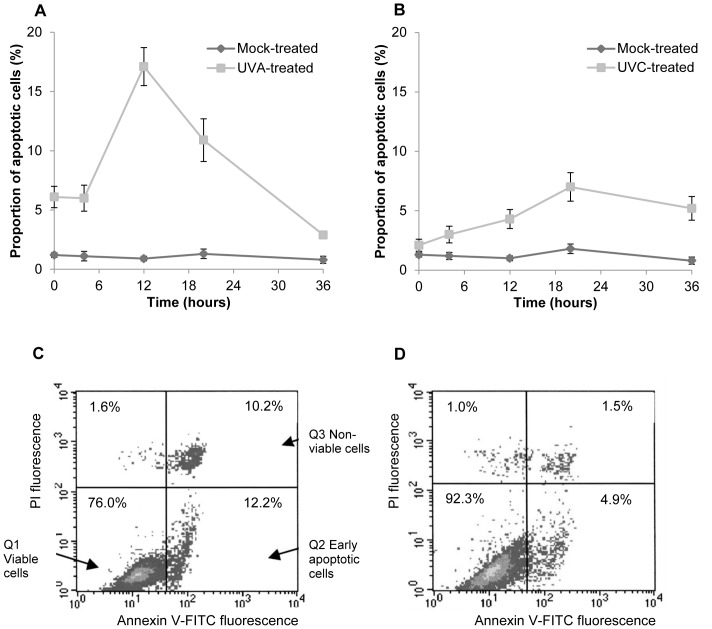
Figure 4. Induction of cell death in fibroblasts after exposure to ultraviolet radiation.
Post-exposure time courses of induction of apoptosis in mouse fibroblasts exposed to A 1×10⁵ Jm−2 UVA and B 5 J m−2 UVC as determined by fluorescein isothiocyanate -annexin V/propidium iodide staining and fluorescence activated cell sorting flow cytometry. The percentages of annexin V-binding only cells are shown and each data point represents the mean of three independent experiments ± S.E.M. Representative density dot plots are shown for the respective peaks of apoptosis induction C 12 hours after UVA exposure and D 20 hours after UVC exposure. The lower left quadrant shows the viable cells, which exclude propidium iodide and are negative for fluorescein isothiocyanate -annexin V binding (Q1). The upper right quadrant (Q3) contains non-viable cells, positive for annexin V- fluorescein isothiocyanate binding and the uptake of propidium iodide. The lower right quadrant (Q2) represents the apoptotic cells, which are positive for annexin V- fluorescein isothiocyanate binding but exclude propidium iodide, demonstrating cytoplasmic membrane integrity. S.E.M = Standard error of the mean; UVA = ultraviolet A; UVC = ultraviolet C.

