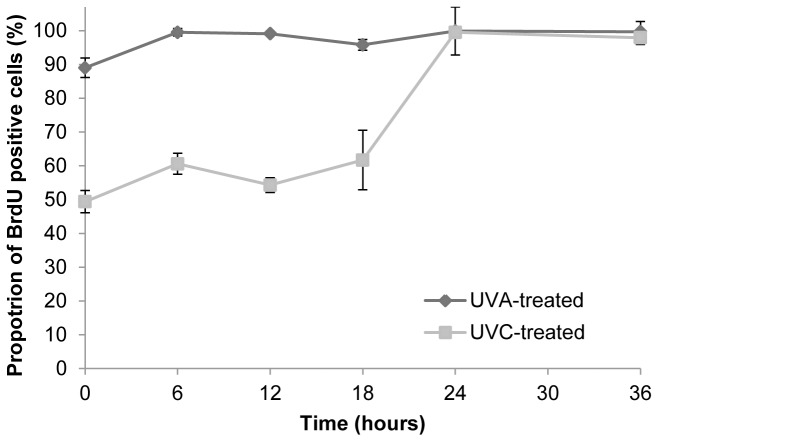
Figure 5. The progression of cells irradiated in S phase of the cell cycle.
Cells were pulse-labelled with bromodeoxyuridine for 1 hour prior to sampling. The mean green fluorescence intensity of irradiated cells is shown as a percentage of the corresponding mock-irradiated cells at each time point following irradiation. Results shown are the mean ± S.E.M. of three independent experiments. S.E.M. = standard error of the mean; UVA = ultraviolet A; UVC = ultraviolet C.

