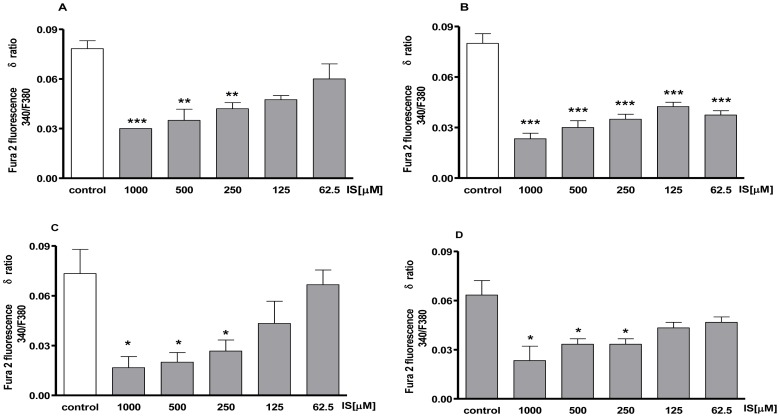
Figure 2. Concentration – related effect of IS on [Ca2+]i concentrations.
Intracellular calcium concentration was evaluated on J774A.1 cells in Ca2+-free medium 30 minutes (panel A) or 2 h (panel B) after IS treatment (1000–62.5 µM). Effect of IS on mitochondrial Ca2+ pool was evaluated on J774A.1 cells in Ca2+-free medium in presence of FCCP (0.05 µM) added for 30 minutes (panel C) or 2 h (panel D) after IS treatment. Results were expressed as mean±s.e.m. of delta (δ) increase of FURA 2 ratio fluorescence (340/380 nm) from three independent experiments. Data were analyzed by ANOVA, and multiple comparison were made by Bonferroni's test. ***, ** and * denote P<0.001, P<0.01 and P<0.05 respectively versus control cells (J774A.1 in medium without LPS nor IS).

