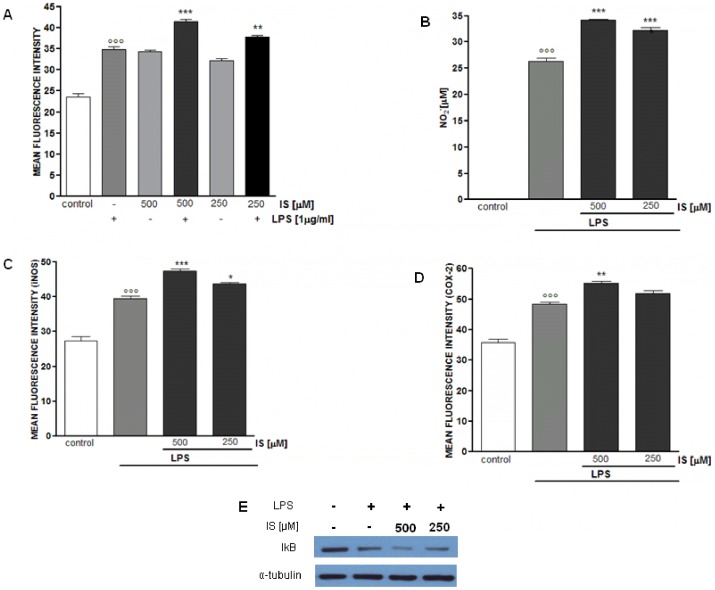
Figure 7. Effect of IS on murine peritoneal macrophages.
ROS formation was evaluated by H2DCF-DA in peritoneal macrophages treated with IS (500–250 µM) for 1 h. Where indicated IS was also added together with LPS (1 µg/ml) for 15 minutes (panel A). Peritoneal macrophages were treated with IS (500–250 µM) for 1 h and then co-exposed to LPS (1 µg/ml) for further 24 h to assess NO release (panel B), iNOS (panel C) and COX 2 (panel D) expression. In order to evaluate the effect of IS on NF-kB pathway macrophage were treated with IS for 1 h, then together with LPS for 10 minutes and IkB- α degradation was assed by Western blot, a representative of three experiments was shown (panel E). Results are expressed as mean±s.e.m. from three independent experiments. Data were analyzed by ANOVA test, and multiple comparison were made by Bonferroni's test. °°° denotes P<0.001 versus control. ***, ** and * denote P<0.001, P<0.01 and P<0.05 respectively versus peritoneal macrophages treated with LPS alone.

